Xy Plot
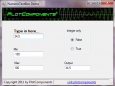
NumericTextBox v.1.0
PlotPad is a .net component that provides a visual control to visualize data in cartesian plots. Developers of WinForms applications can easily create xy-, yt- or scope-plots by simply feeding the component with their data.
LabChart Reader v.7.2.1400
LabChart Reader is a free application program that allows you, your colleagues and students to view and conduct limited analysis of LabChart data files.
Screenshot Helper v.1.2
Screenshot Helper shows a full screen window with a solid color or a desktop picture so that you can take clean screenshots without having irrelevant windows and desktop icons in the background.
Plot Digitizer v.2. 4. 2001
Plot Digitizer is a great piece of software developed by Joseph A. Huwaldt. The main goal of the program is to extract information from two-dimensional plots or graphs.
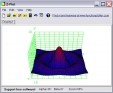
Rt-Plot v.2.8.10.84
Rt-Plot is a tool to generate Cartesian X/Y-plots from scientific data. You can enter and calculate tabular data. View the changing graphs, including linear and non linear regression, interpolation, differentiation and integration, during entering.
Z-Plot v.1 1
Z-Plot is a free plotting software that allows you to visualize a multitude of mathematical functions and curves. The software has a powerful mathematical formula interpreter, that also allows the user to handle complex numbers, easily.
Fry Plot Program v.1 1
The program developed very useful and versatile in the sense that complete annotation of the plot and caption and legend and printing facility is available in the very program and you do not, unlike other programs, have to export the plot to other pr
XY Family Tree v.3 5
XY Family tree displays your ancestors, descendants and relatives on your PC and, optionally, in your own folder on the XY Family Tree website. You can create broad trees or tall trees. Large trees can be separated into distinct families very easily.
Ramachandran Plot Explorer v.1.0
View protein files with this software. The Ramachandran Plot Explorer is designed to make it easy to examine the conformation of a polypeptide - through the interactive Ramachandran plot ( - angles) and -angle tool. Simply click on a residue,
Complex Function Plot v.1.0
Plot complex function of position and time with the help of this tool. Complex Function Plot software displays a user-defined complex function of position and time using representations that map phase into color.
XY Model v.1.0
Planar ferromagnet simulation. The STP XY Model software implements a Monte Carlo simulation of the planar ferromagnet or XY Model of spins on a lattice. The simulation returns the configuration of spins with the option of showing the vortices.
Function Plot 2D v.1.0
Create function plots fast and easy. Function Plot 2D help you create function plots. Function Plot 2D lets you create a 2D plot, all you need to do is give an input function.Requirements: *